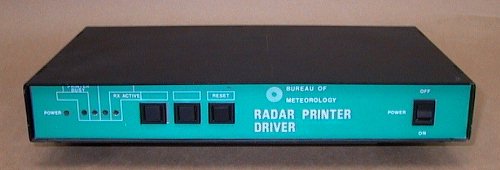
In1990 the Radar Printer Driver was developed to make up the shortfall in supply of Radar Printer Interfaces as the imported Z80 processor card was no longer being made. With around twenty radars still requiring an ancillary unit to calculate winds and drive a a printer, the R.P.D. was conceived. It was decided that with new firmware, a new front panel and the addition of a Centronics interface, the redundant Radar Data Communication Interface Units could perform this function. Purposefully a different colour front panel was chosen to differentiate the unit from the Radar Data Communication Interface.
General Description
 The
Radar Printer Driver like it's predecessor the Radar Printer Interface was designed
to to provide the printing of wind-find data from either a WF44 radar or a WF3
radar Raprint unit . It also would only calculate the wind data if the radar
output was in the correct format. Else it would only allow the printing of the
the raw radar data without calculations. If faults in the radar were causing
erroneous readings, the observer would review the data and then estimate the
winds. Both station height and earth curvature were included in the wind calculations.
The
Radar Printer Driver like it's predecessor the Radar Printer Interface was designed
to to provide the printing of wind-find data from either a WF44 radar or a WF3
radar Raprint unit . It also would only calculate the wind data if the radar
output was in the correct format. Else it would only allow the printing of the
the raw radar data without calculations. If faults in the radar were causing
erroneous readings, the observer would review the data and then estimate the
winds. Both station height and earth curvature were included in the wind calculations.
Deployment
As used on the following WF44 and WF3 radars;
Adelaide, Alice Springs, Brisbane, Broadmeadows WF44, Broome, Canberra, Gladstone,
Mackay, Laverton, Mt Isa, Port Hedland, Perth, Woomera, Williamtown.
In total about 20 units were built including spares.
All of the units on WF44 radars were removed in the late 1990's when they were
upgraded with the introduction of PC Radwin.
* Perth Airport WF44 radar was changed to a Radar Printer Interface in 1992
for use in an EPA experiment.
Construction
Operation
For example
Mascot WF3 Station Height = 5m
C TIME RANGE AZIM ELEV HGHT SP DIR
This indicates the station name - Mascot WF3 and the official station height.
The second line forms the headings for the printout columns.
SAMPLE PRINTOUT
|
Mascot WF3 Station Height = 5m |
|||||||
| C |
TIME
|
RANGE
|
AZIM
|
ELEV
|
HGHT
|
SP
|
DIR
|
|
205 |
01.0 |
000.44 |
257.0 |
35.8 |
262 |
6 |
257 |
|
205 |
02.0 |
000.85 |
262.0 |
34.3 |
484 |
6 |
267 |
|
205 |
03.0 |
001.36 |
263.1 |
32.7 |
740 |
7 |
265 |
|
205 |
04.0 |
001.88 |
262.7 |
34.8 |
1078 |
7 |
262 |
|
205 |
05.0 |
002.42 |
265.0 |
35.2 |
1400 |
7 |
273 |
|
205 |
06.0 |
003.04 |
261.8 |
34.4 |
1723 |
9 |
250 |
|
205 |
07.0 |
003.73 |
259.8 |
33.3 |
2054 |
10 |
252 |
|
205 |
08.0 |
004.58 |
260.4 |
31.5 |
2399 |
13 |
263 |
|
205 |
09.0 |
005.37 |
262.2 |
30.5 |
2732 |
12 |
272 |
|
205 |
10.0 |
006.05 |
263.4 |
30.5 |
3077 |
10 |
273 |
|
205 |
11.0 |
006.74 |
264.4 |
30.4 |
3418 |
10 |
273 |
|
205 |
12.0 |
007.55 |
265.7 |
30.0 |
3783 |
12 |
276 |
|
205 |
13.0 |
008.42 |
265.7 |
29.5 |
|
|
|
|
205 |
14.0 |
009.34 |
266.2 |
28.8 |
4509 |
14 |
268 |
|
205 |
15.0 |
010.40 |
267.7 |
27.8 |
|
|
|
|
205 |
16.0 |
011.55 |
267.4 |
26.7 |
5202 |
18 |
272 |
|
205 |
17.0 |
012.71 |
267.1 |
25.9 |
|
|
|
|
205 |
18.0 |
013.79 |
267.3 |
25.3 |
5909 |
18 |
267 |
|
205 |
19.0 |
014.91 |
266.8 |
24.8 |
|
|
|
|
205 |
20.0 |
016.01 |
266.7 |
24.4 |
6633 |
18 |
263 |
|
205 |
21.0 |
017.11 |
266.6 |
23.7 |
|
|
|
|
205 |
22.0 |
018.31 |
266.4 |
23.2 |
7237 |
19 |
264 |
|
205 |
23.0 |
019.49 |
266.8 |
22.8 |
|
|
|
|
205 |
24.0 |
020.72 |
267.2 |
22.1 |
7825 |
20 |
273 |
|
205 |
25.0 |
022.08 |
267.2 |
21.5 |
|
|
|
|
205 |
26.0 |
023.50 |
268.2 |
20.9 |
8421 |
23 |
275 |
The first column 'C' is the CODE. This was sent from the radar to indicate
which mode it was in
0 - Visual Control
1 - Manual Control
2 - Steer Mode
3 - Auto Follow
The next two digits came from thumbwheel switch settings on the radar console
and were set as desired by the observer.
Once the 12th minute had passed the unit then only calculated the winds every two minutes.